Troubleshoot failed triggers
Currently, this feature is behind the feature flag CDS_TRIGGER_ACTIVITY_PAGE. Contact Harness Support to enable the feature.
You can troubleshoot failures of your cURL or webhook initiated triggers in the Harness platform.
After a trigger runs, you can use the Trigger Explorer to troubleshoot cURL or webhook initiated failures. For cURL, you enter the eventCorrelationId from the response. For webhooks, you enter the data value from the webhook response payload.
Troubleshoot webhook failures
To troubleshoot webhook failures, do the following:
- cURL trigger
- Webhook trigger
Open your Harness pipeline in Pipeline Studio.
Select Triggers.
Select Trigger Explorer.
Select Webhook.
In Enter Event Correlation id, enter the
eventCorrelationIdvalue from the cURL response payload.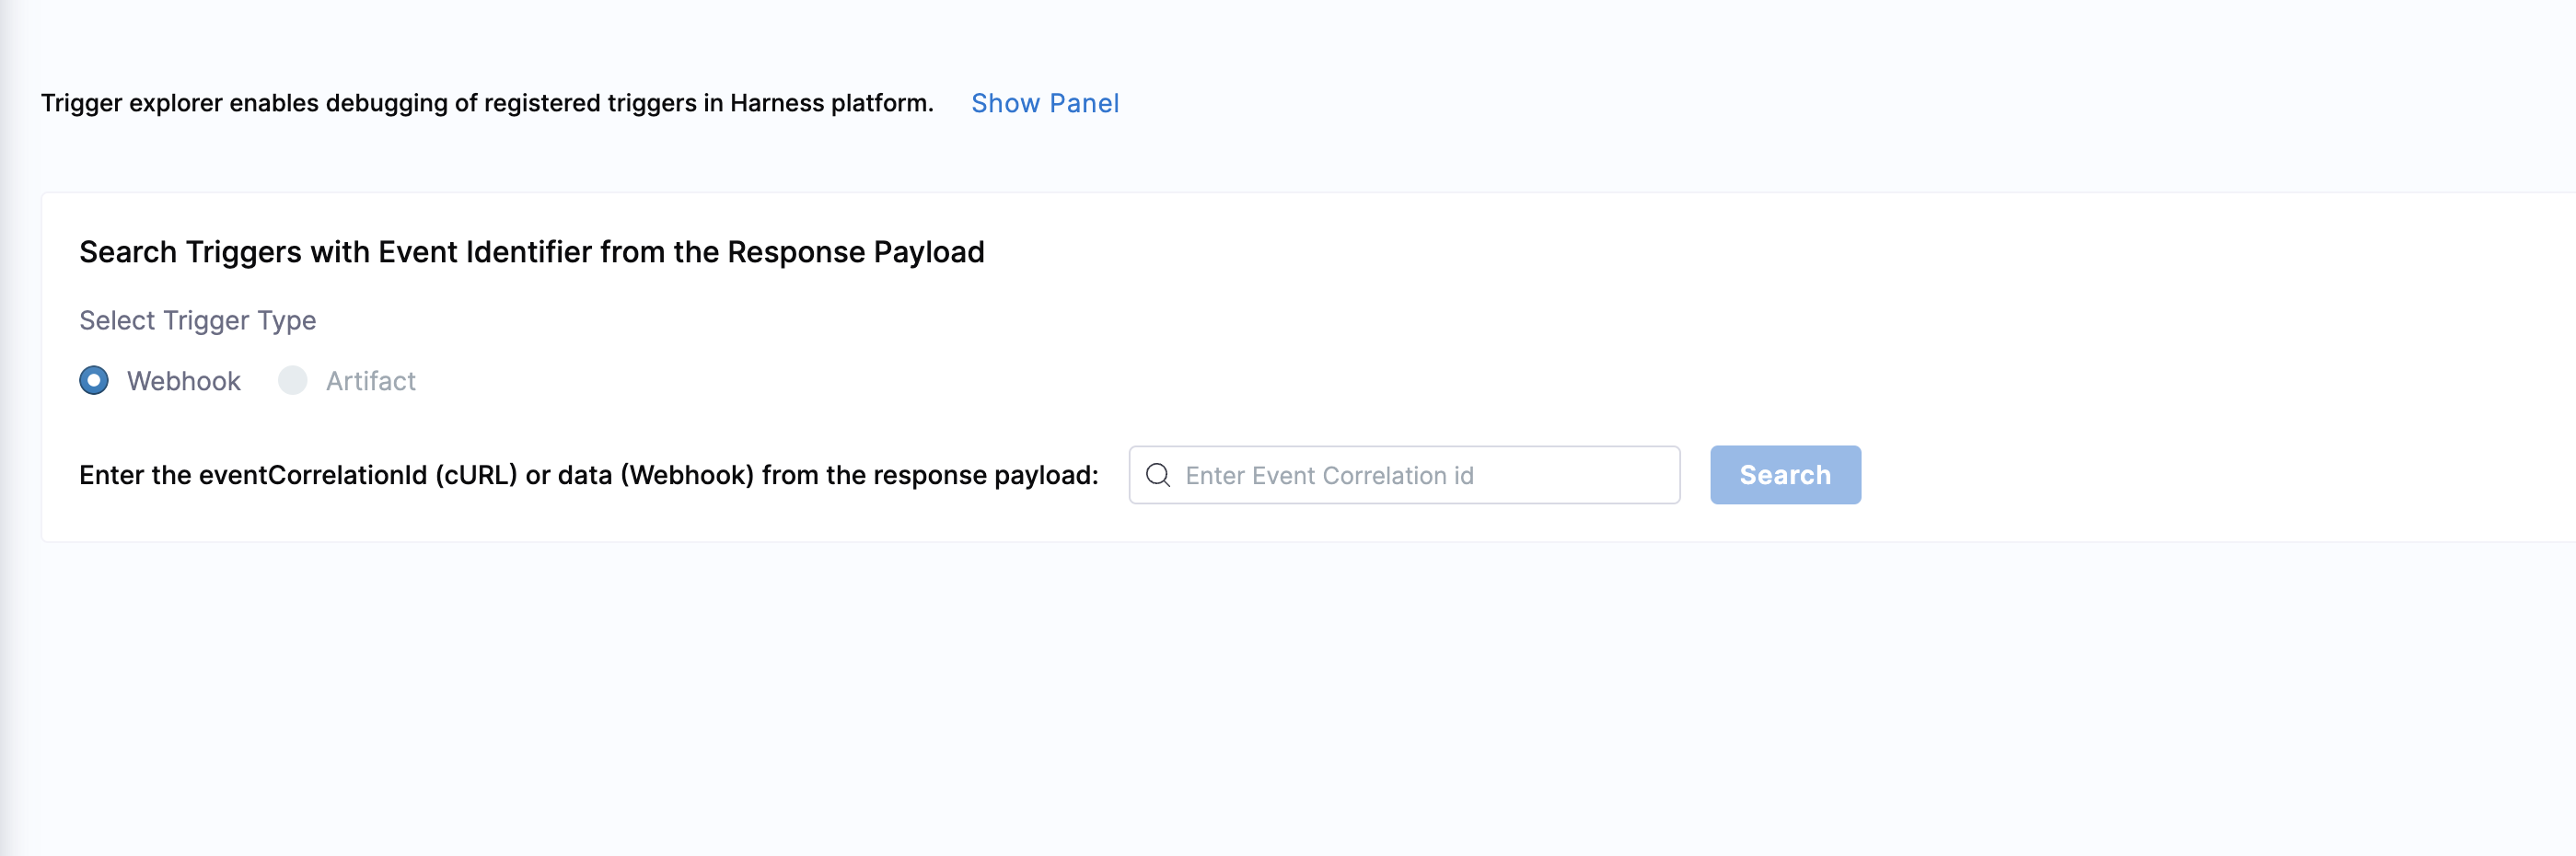
Select Search.
Harness returns the following information:
- Event Correlation Id
- Trigger Name
- Trigger Status
- Message
- Payload
cURL example
Sample cURL command
~ % curl -X POST -H 'content-type: application/json' --url 'https://app.harness.io/gateway/pipeline/api/webhook/custom/v2?accountIdentifier=<YOUR_ACCOUNT_ID>&orgIdentifier=default&projectIdentifier=CD_Docs&pipelineIdentifier=tweety&triggerIdentifier=Custom' -d '{"sample_key": "sample_value"}'
Sample response
{"status":"FAILED","data":{"eventCorrelationId":"64e3e215d2bb844cfab9e155","apiUrl":"https://app.harness.io/gateway/pipeline/api/webhook/triggerExecutionDetails/64e3e215d2bb844cfab9e155?accountIdentifier=<YOUR_ACCOUNT_ID>","uiUrl":"https://app.harness.io/ng/#/account/<YOUR_ACCOUNT_ID>/cd/orgs/default/projects/CD_Docs/deployments?pipelineIdentifier=tweety&page=0","uiSetupUrl":"https://app.harness.io/ng/#/account/<YOUR_ACCOUNT_ID>/cd/orgs/default"}}
In this example, you enter the eventCorrelationId value in the Search field.
Open your Harness pipeline in Pipeline Studio.
Select Triggers.
Select Trigger Explorer.
Select Webhook.
In Enter Event Correlation id, enter the
datavalue from the webhook response payload.Select Search.
Harness returns the following information:
- Event Correlation Id
- Trigger Name
- Trigger Status
- Message
- Payload
Webhook example
The pipeline below runs when a repo has a PR.
This example uses the tweety repo.
Sample pipeline URL
https://app.harness.io/ng/account/<YOUR_ACCOUNT_ID>/cd/orgs/default/projects/CD_Docs/pipelines/tweety/executions?storeType=INLINE
Sample response
{"status":"FAILED","data":"64e3e5b58cdd8704d75bd99d","metaData":null,"correlationId":"1a75bbef-862c-469e-b8ab-e06dd95e4999"}
In this example, you enter the data value in the Search field.